Quota attainment shows if insurance agent targets were fair.
August 13, 2024
Pulkit Agarwal
Pulkit Agarwal
Key Insights
SalesGlobe's 2026 research finds about 52% of sellers reach quota on average.
In this blog:
Why the average hides whether agent targets were fair
How to separate activation from productivity
How to adjust quota attainment for persistency and vintage
What attainment rate an insurance agency channel should plan for
I sit with insurance sales heads who see one number each quarter. Branch attainment is 98%. The board is satisfied. Then we open the histogram. A large group sits near zero.
Agency is a channel of lakhs of agents. Many join, and many leave within the year. Each target decision lands on a wide and young field. A fair target suits a planned share of active, tenured agents.
The good news is that the data already exists. It needs to be read by branch, vintage and persistency.
A question worth asking the head of agency this week: what share of active agents reached target, by branch?
SalesGlobe's 2026 research finds about 52% of sellers reach quota on average.
In this blog:
Why the average hides whether agent targets were fair
How to separate activation from productivity
How to adjust quota attainment for persistency and vintage
What attainment rate an insurance agency channel should plan for
I sit with insurance sales heads who see one number each quarter. Branch attainment is 98%. The board is satisfied. Then we open the histogram. A large group sits near zero.
Agency is a channel of lakhs of agents. Many join, and many leave within the year. Each target decision lands on a wide and young field. A fair target suits a planned share of active, tenured agents.
The good news is that the data already exists. It needs to be read by branch, vintage and persistency.
A question worth asking the head of agency this week: what share of active agents reached target, by branch?
Table Of Content
What the numbers say about agents and targets
SalesGlobe reports that about 52% of sellers reach quota on average. It calls 50% to 70% a healthy range. Timing matters too. Quotas issued by the end of month one saw 54% reach them. By month three, that fell to about 41%.
Alexander Group sets a similar guide. In a typical period, about 60% of reps should hit plan. Fewer than 40% of executives it surveyed track quota distributions regularly.
India's agency channel is large. Life insurers had 28.95 lakh individual agents on 31 March 2024. In 2023-24, they appointed 9.75 lakh agents. They terminated 6.98 lakh for missing minimum business.
Sources: SalesGlobe, Sales Compensation: The Big Issues of 2026, 14 September 2026, two surveys of practitioners, sample not disclosed, cross-industry · Alexander Group, How to Analyze Your Quota Distributions, Dave Eddleman, undated · IRDAI annual report data for 2023-24 as reported by Deccan Chronicle, 2 March 2025 · IRDAI Annual Report 2024-25 as reported by Outlook Money, 1 January 2026 · press summaries of regulator data, not the report itself
Plan for half to two-thirds at target, in a channel that churns lakhs of agents.
Why the average hides the fairness question
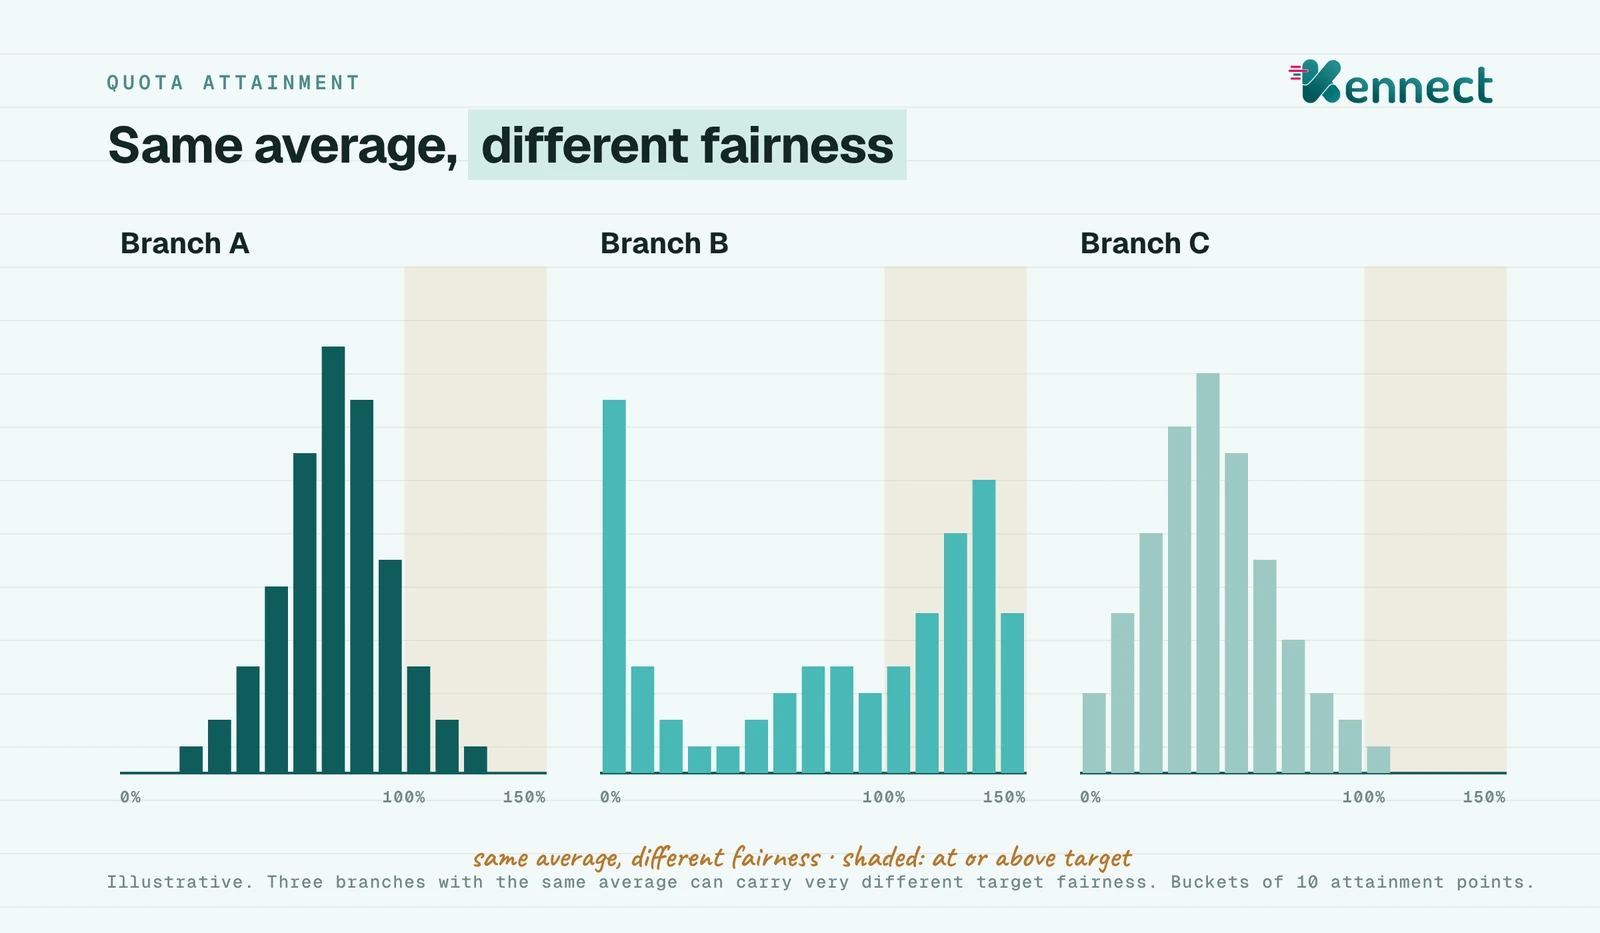
An average of 100% can hide two different channels. In one, nearly all agents sit near target. In the other, a few stars carry many idle agents. Both report the same number to the board.
Read the spread instead. Alexander Group suggests three years of data. Build a histogram with a bucket for every 10 points of attainment. Then cut it by branch, by channel and by agent vintage.
Illustrative. Three branches with the same average can carry very different target fairness.
Four shapes tell four stories.
A bell near 100%. Targets fit the bulk of agents.
Two peaks. Targets fit one group and miss another.
A tall bar near zero. Many agents are inactive, not underperforming.
A long right tail. A few agents carry the branch, and their targets may be soft.
Compare branches with care. A metro branch and a rural branch face different markets. Their agents differ in tenure too. Put two branches side by side when both have similar vintage mix. Otherwise the gap reflects recruiting, not targets.
Repeat the cut every quarter. A shape that holds for three quarters is a design issue. A shape that appears once may be a data issue.
Read quota attainment as a spread by branch, because averages hide unfair targets.
Separate activation from productivity
Agency attainment mixes two questions. Did the agent sell at all? If so, how much against target?
Activation is the share of agents with one policy or more. Productivity is attainment among active agents. A branch can fail on either one. The fixes differ.
Two measures that should be read apart in an agency channel.
Measure
Question
Typical fix
Activation
Did the agent sell this month?
Onboarding, licensing support, first-policy bonus
Productivity
How far did active agents get?
Target level, slab design, coaching
Attainment
Share at or above target
Read after the two above
The IRDAI terminations show why activation comes first. An agent dropped for missing minimum business never tested the target. Counting them in attainment drags the average down. It also hides how active agents performed.
A first-policy bonus helps activation. A slab design helps productivity. The commission side is covered in insurance agent commission software.
Report activation and productivity apart, and set targets for active agents.
Adjust quota attainment for persistency and vintage
A policy lapsing in month two still counts as new premium. It should not count the same in attainment.
Persistency-adjusted attainment weights sales by what renews. Here is an illustrative case.
Illustrative. Two agents, before and after a 13th month persistency adjustment.
Agent
Raw attainment
13th month persistency
Adjusted attainment
Agent A
120%
60%
72%
Agent B
95%
90%
85.5%
Agent A tops the raw table. Agent B sold business that stays. The adjusted view changes who looks like a role model.
Vintage matters as much. Group agents by the year they were appointed. A first-year cohort should carry activation targets. A third-year cohort should carry productivity targets. Mixing them makes every target look wrong.
A simple cohort table helps. Put appointment year in rows. Put activation, attainment and persistency in columns. Read each row against the row above it. A cohort that activates slowly needs onboarding help. A cohort that activates but lapses needs a look at how it sells.
Sources: Cafemutual, FY25 life insurer persistency analysis, 16 June 2025, insurer public disclosures, no industry average given · illustrative table built by Kennect, not insurer data
Weight attainment by persistency and vintage, so renewing business wins.
What quota attainment rate an insurance agency channel should target
Plan the share of agents who reach target before the year starts. SalesGlobe's healthy range is 50% to 70% of sellers. Alexander Group's guide is about 60%.
Apply the range to active agents with a year or more of tenure. Set first-year agents on activation and early persistency. Then read the result every month.
Three signals call for review.
Below 40% at target. Targets may be too high, or set too late.
Above 80% at target. Targets may be too soft, and payout cost rises.
A branch far from the rest. Check territory, vintage mix and data before blaming people.
Timing is part of fairness. An agent who learns the target in June has lost a quarter. SalesGlobe's data links late quotas to fewer sellers at target. Issue the agency target in the first week of April. Share the method with branch managers in March.
Watch the base too. A target built from this year's actuals punishes the agents who stretched. That pattern is described in target ratcheting.
Sources: SalesGlobe, 2026, cross-industry, not insurance specific · Alexander Group, Get Sales Quotas Right, undated checklist
A fair target lets 50% to 70% of tenured, active agents reach it.
How Kennect helps read quota attainment across agents and branches
Many sales teams we work with read attainment once a quarter. We make it visible every day.
The management cockpit. Leadership sees attainment by branch, channel and vintage in one view. The analyze module shows the spread beside the average.
Target setting and versions. Targets are set and shared from one place. Each change is held as a dated version with its reason.
The agent's own view. Each agent sees target, achievement and the slab reached. A what-if simulator shows what one more policy earns. Leaderboards show standing within the branch.
Return on what was paid. Compare each cohort with a matched group of peers. That shows whether payout bought extra business.
One Kennect deployment covered about 8,000 representatives. The share earning an incentive rose from 34% to 76%.
Source: Kennect claim register · share of the field earning an incentive rose from 34% to 76% · one deployment, about 8,000 representatives, same cohort · not an insurance deployment
Kai, Kennect's AI: Kai writes coaching summaries for branch managers. Each summary shows where agents stand against target. Kai writes earnings summaries for agents in plain language. Expected January to March 2027: payout deep-dives for leadership. A CSO could then ask questions of payout outcomes.
Weekly visibility lets targets be fixed before the year closes.
What this means for January to March 2027
The fourth quarter of FY 2026-27 starts on 1 January. It is the time to read this year's spread. Pull the histogram by branch and vintage now. Split activation from productivity. Adjust for 13th month persistency.
Then set FY 2027-28 targets with a planned share in mind. Issue them in April, not in May or June. Quotas issued by month three saw about 41% reach them.
Read the spread in January, and issue next year's targets by April.
Quota attainment is fair when the spread, not the average, lands where you planned.
About 52% of sellers reach quota on average, SalesGlobe finds. Reading the spread by branch, vintage and persistency shows which agency targets were fair.
See how Kennect shows attainment across agents and branches.