Measure incentive impact on revenue one scheme at a time.
October 6, 2026
Puneet Gupta
Puneet Gupta
Key Insights
After every festive season I sit with sales finance heads who know their scheme spend to the rupee. They can tell me what was paid to dealers and distributors, which circular it came from and which month it was booked in.
Then someone asks the question that matters: which of those rupees bought a sale that would not have happened anyway? The answer is slow to come, from very capable people, because the spend, the claim and the sale sit in three different places.
There is a practical way to answer it. Set a baseline before the scheme opens. Write the objective in the unit the scheme pays. Keep each payout on the same record as the sales that earned it. Then read the extra sales against the baseline, and carry that reading into the next scheme. The books cannot do this on their own, because Ind AS 115 nets schemes off revenue and shows the total.
A question worth asking the head of sales finance this week concerns the festive scheme that closed in November 2025. What share of its payout went on sales that would have happened without it?
After every festive season I sit with sales finance heads who know their scheme spend to the rupee. They can tell me what was paid to dealers and distributors, which circular it came from and which month it was booked in.
Then someone asks the question that matters: which of those rupees bought a sale that would not have happened anyway? The answer is slow to come, from very capable people, because the spend, the claim and the sale sit in three different places.
There is a practical way to answer it. Set a baseline before the scheme opens. Write the objective in the unit the scheme pays. Keep each payout on the same record as the sales that earned it. Then read the extra sales against the baseline, and carry that reading into the next scheme. The books cannot do this on their own, because Ind AS 115 nets schemes off revenue and shows the total.
A question worth asking the head of sales finance this week concerns the festive scheme that closed in November 2025. What share of its payout went on sales that would have happened without it?
Table Of Content
How large the scheme line has become
The line is large. McKinsey reported in 2019 that consumer goods companies invest about 20% of revenue in trade promotions. It cited Nielsen research finding that 59% of those promotions lost money. Dealer and distributor schemes in auto and durables are run the same way, and are read the same way.
Source: 20% and 59% · McKinsey, "How analytics can drive growth in consumer packaged goods trade promotions", 23 October 2019, citing Nielsen, 2016 · global consumer goods, not automotive and not India-specific
Scheme spend is a large line in a channel business, and its return is rarely measured.
Why the scheme total cannot show what it earned
Three gaps keep the return out of reach. Each one has a different fix.
The baseline is missing
A scheme read as this year against the previous year credits itself with everything else that changed. Festive 2025 is a hard comparison.
GST on small cars and two-wheelers up to 350cc fell from 28% to 18% on 22 September 2025. FADA's 42-day festive retail that year rose 21.10%. Any festive 2026 scheme measured on raw year-on-year growth inherits that distortion, in auto and in every category the tax change touched.
The lift is read gross
Sales rise during a scheme, and the whole rise is credited to it. Some of that rise was always going to happen. Some moved from one brand or outlet to another. Some was pulled forward from next month and will be missing when next month closes.
The spend sits in a total
Finance books schemes under Ind AS 115, which treats discounts, rebates and incentives as variable consideration netted from revenue. That gives a correct total for the period. The total carries no reading of which scheme earned its cost.
A scheme total records the spend accurately, and these three gaps keep its return out of view.
How to measure each scheme, step by step
A closed loop ties each scheme to its own evidence and carries the reading forward. Five steps, in order.
1. Set the baseline before the scheme opens
Estimate what each dealer or distributor group would sell without the scheme. A matched set outside the scheme gives a clean comparison. A staggered launch, with one region a cycle behind, gives a usable second.
2. Write the objective in the unit the scheme pays
If the business wants retail, the objective is retail units. If it wants a new model or SKU placed, the objective is that product's sales. The objective is written before the scheme opens, with a number against it.
3. Hold the payout on the same record as the sale
The comparison needs every payout tied to the sales rows that earned it. When the claim sits in a settlement sheet and the sale in a DMS, nobody can say which sales the scheme paid for. One record also gives the dealer or distributor the same view the business has.
4. Read the return on incremental units
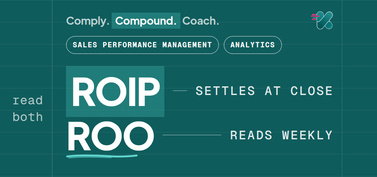
Compare scheme participants against the baseline. Take the margin on the difference, then net the payout against it. That is reading a scheme's return with ROIP, scheme by scheme instead of for the plan as a whole.
5. Feed the reading into the next scheme
The next circular starts from what the previous one returned. A scheme that bought little new business gets redesigned or dropped. A scheme that worked gets modeled at the next budget before anyone writes the circular.
The difference shows across the whole cycle.
A scheme read as a total, and the same scheme in a closed loop
Question
Scheme read as a total
Scheme in a closed loop
What it is compared against
The same month a year earlier
A baseline set before the scheme opened
How the lift is counted
All of it
Incremental units, net of the payout
Where the payout sits
A settlement sheet or credit note
The same record as the sales that earned it
When finance sees the return
Never, beyond the total booked
At close, per scheme
What the next scheme starts from
The previous circular's wording
The previous scheme's measured reading
A national scheme with every dealer enrolled has no untouched group. Use the staggered launch, or compare participants just above a slab threshold with those just below it. Name the substitute in the same sentence as the result.
A closed loop measures incentive impact on revenue scheme by scheme, and hands each reading to the scheme that follows.
What one retailer found when it measured properly
One rigorous study shows why the baseline matters. Kusum Ailawadi and colleagues measured promotions across CVS, the US drugstore chain, separating new sales from sales that moved between brands or forward in time.
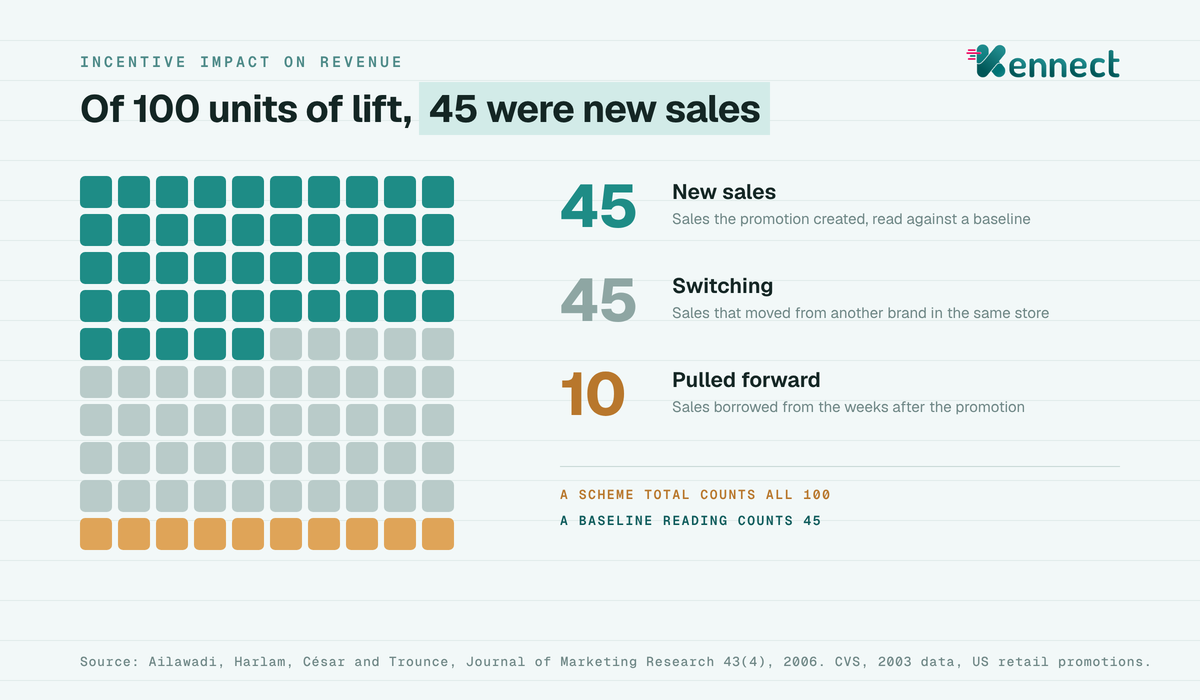
About 45% of the gross lift was incremental. About 45% was switching within the store. About 10% was stockpiling, sales borrowed from future weeks. More than half of the promotions were not profitable for the retailer.
Source: Ailawadi, Harlam, César and Trounce, "Promotion Profitability for a Retailer: The Role of Promotion, Brand, Category, and Store Characteristics", Journal of Marketing Research, vol. 43, no. 4, 2006, pages 518 to 535 · CVS, 2003 data · about 36 million promotions across 189 categories and 3,808 stores
The limit is clear. This is a US retailer measuring consumer promotions, more than twenty years ago. OEMs, dealer and distributor schemes and India all sit outside it.
What carries across is the arithmetic. A scheme read on gross lift would have claimed all 100 units. Read against a baseline, 45 of them were new. Channel schemes have a similar structure: some sales are new, some move between outlets, and some are pulled forward from next month.
What the lift was made of, from Ailawadi and colleagues, Journal of Marketing Research, 2006
Measured against a baseline, less than half of an apparent lift was new business, and a scheme total cannot show which half.
How Kennect reads scheme spend
Across the deployments we run, the scheme reviews that lead somewhere are the ones where the scheme, the payout and the sale share one record. So we build that record.
We bring scheme rules, dealer and distributor sales, and the retail or secondary data the business already receives into one place. Distributor schemes read the same secondary sales data that Secondary Sales Automation brings in.
We calculate each scheme's payout against the rows that earned it. Dealers and distributors see the claim build during the month, which is the job channel sales visibility software is bought to do.
We read each scheme against its baseline once it closes, through AI Performance Insights. We keep each scheme's reading beside the draft of the next one.
Finance sees the return on each scheme beside the total it already books. Sales leadership sees which scheme bought new business and which paid for sales that were coming anyway. The channel team keeps writing circulars the way it does today.
Kennect publishes no return figure of its own. When a scheme reading is measured to this method, it is published with its baseline, its period and its stated limit.
One record from circular to claim to sale is what turns a scheme total into a scheme return.
What this means for the next festive budget
Scheme spend will keep rising in the years when demand needs support. The question for finance is whether each rupee is read for what it returned. That reading needs a baseline, a written objective, a payout on the same record and a comparison group, carried into the next scheme. It is the Compound stage of managing sales incentives, where the number is planned from what the previous one showed.
The next festive scheme can start from a measured reading of this one, and that is the case for closing the loop.
A closed loop reads what each scheme bought, against a baseline set before it opened, and hands that reading to the next scheme while it can still change.
See how AI Performance Insights reads each scheme against its baseline once the scheme closes.


.jpeg)