Multi-division pharma incentives need one engine for every plan
November 20, 2026
Pulkit Agarwal
Pulkit Agarwal
Key Insights
Pharmarack now projects GLP-1 agonists to grow 111% in 2026, and anti-infectives 7.3% (Pharmarack, July 2026).
In this blog:
Why divisions multiply incentive work
What should differ between divisions, and what should not
Five steps to run many division plans on one set of rules
How Kennect runs multi-division pharma incentives
I hear a version of this from many pharma sales operations heads. Each division wants its own plan. Chronic wants one thing, acute another, the launch team a third. So each gets its own spreadsheet. Then a common rule changes, and every sheet needs the same fix.
Divisions should differ. Their markets grow at different speeds, and their MRs do different work. Different plans are fine. Payouts go wrong when they run on different files. Habits differ, and no common record exists.
Ask your sales ops head this week: if one rule changed tomorrow, how many files need editing?
Pharmarack now projects GLP-1 agonists to grow 111% in 2026, and anti-infectives 7.3% (Pharmarack, July 2026).
In this blog:
Why divisions multiply incentive work
What should differ between divisions, and what should not
Five steps to run many division plans on one set of rules
How Kennect runs multi-division pharma incentives
I hear a version of this from many pharma sales operations heads. Each division wants its own plan. Chronic wants one thing, acute another, the launch team a third. So each gets its own spreadsheet. Then a common rule changes, and every sheet needs the same fix.
Divisions should differ. Their markets grow at different speeds, and their MRs do different work. Different plans are fine. Payouts go wrong when they run on different files. Habits differ, and no common record exists.
Ask your sales ops head this week: if one rule changed tomorrow, how many files need editing?
Table Of Content
Why divisions multiply incentive work
Indian pharma companies split their field force by therapy. Each division sells a different basket to different doctors.
Those baskets grow at very different speeds. The Indian pharma market closed 2025 at ₹2,40,672 crore, up 8.1%. In July 2026, Pharmarack raised its 2026 forecast to 11.3%. Within that, it projects cardiac at 14% and anti-diabetics at 13.2%. GLP-1 agonists are projected at 111%, while anti-infectives sit at 7.3%.
The forecast itself moved too. In January, Pharmarack expected 7.8% to 8.1% growth for 2026. By July, it expected 11.3%. Targets set on January's outlook were stale by mid-year in several divisions.
So each division needs its own targets, focus brands and weights. That part is right. Trouble starts when each plan also gets its own file and process.
Then the work multiplies. Ten divisions means ten calculations, ten validations and ten sets of approvals. A shared rule, like a new joiner's proration, gets edited ten times. One missed edit means one division pays differently for the same event.
Different division plans are right. Separate files for each are the problem.
What should differ between divisions, and what should not
A good multi-division setup splits the plan into two layers. One layer belongs to each division. The other is shared by all.
Plan element
Division-specific or shared
Why
Focus brands and weights
Division-specific
Each division sells a different basket
Targets
Division-specific
Therapy areas grow at different speeds
Gates (call average, coverage)
Division-specific levels, shared logic
Specialist and GP divisions call differently
Slab structure
Shared shape, division-specific values
MRs who move divisions read one familiar format
Proration for joiners, transfers and exits
Shared
The same event should pay the same way
Data cut-off and payout calendar
Shared
Finance closes one period for every division
Exception approvals
Shared
One approval path, one record
Query path
Shared
MRs and managers raise queries the same way
The split follows one test. If a rule reflects the market, let it differ. If a rule reflects fairness or control, keep it common.
Let markets shape the division layer. Keep fairness and control in the shared layer.
Five steps to run many division plans on one set of rules
Write the shared layer first. Proration, cut-off, approvals and the query path go in one common document. Every division plan refers to it.
Build each division plan as a variant. Start from one template. Change only brands, weights, targets and gate levels. A reviewer then sees what is different at a glance.
Date every version. Each division plan gets a version and an effective date. A mid-year target revision creates a new version. See a mid-year incentive plan change.
Run all divisions in one calculation. Same data feed, same cut-off, same engine. One run means one validation and one approval cycle.
Compare divisions on the same view. Look at payout against achievement, division by division. Add incentive cost as a share of division sales. A plan that pays well on weak results shows up quickly.
Transfers need a rule too. An MR who moves divisions mid-month earns under two plans. Write the split into the shared layer. The method is in retrospective incentive calculation. The dates belong on the incentive time map.
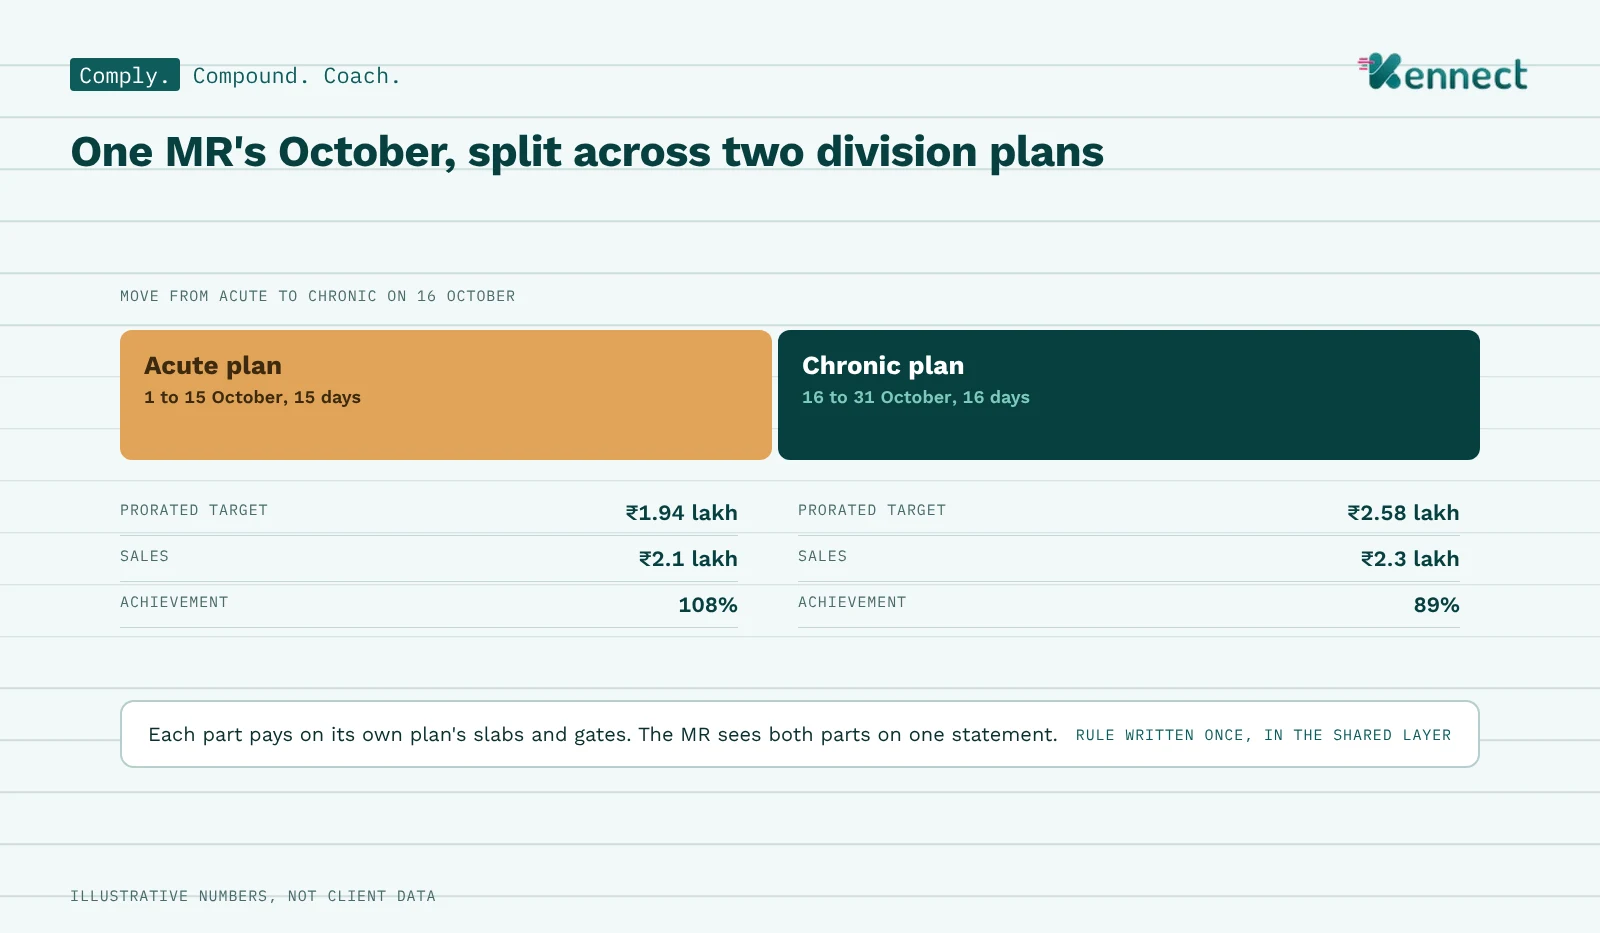
Here is how one move reads. An MR moves from the acute division to chronic on 16 October.
Part of month
Plan
Prorated target
Sales
Achievement
1 to 15 October
Acute
₹1.94 lakh (15/31 of ₹4 lakh)
₹2.1 lakh
108%
16 to 31 October
Chronic
₹2.58 lakh (16/31 of ₹5 lakh)
₹2.3 lakh
89%
Illustrative numbers, not client data.
Each part pays on its own plan's slabs and gates. The MR sees both parts on one statement. The rule is written once, and applies to every move.
One template, dated variants and one run keep many plans manageable.
How Kennect runs multi-division pharma incentives
Kennect is an AI-led sales performance and incentive compensation management platform. It runs incentives for more than 60,000 MRs in India. One rule engine runs every division's plan.
Comply: one engine, many plans. Every division plan runs in one engine, on the same data and cut-off. Each plan is a dated version. The audit trail records who changed what, and when.
Comply: connected data. Kennect connects to HRMS, CRM, SFA and ERP systems through their APIs. All divisions read the same feed. See integrations.
Compound: faster plan setup. KAI Simulations helps set up a new plan from an existing plan document. A new division plan starts from what already works.
Compound: cost before launch. What-if modeling shows a scheme's cost before it goes live. Finance can compare division plans before a rupee is committed.
Coach: payout explanations. Each MR sees every plan's part of the payout on one statement.
KAI in practice. A sales head asks why the chronic division underperformed in one region. KAI Insights shows the brands and HQs behind the gap. An MR asks why his October payout split in two. KAI Exceptions explains both parts and logs the query.
One engine lets each division keep its plan without its own process.
What to fix before FY 2027-28 plans
FY 2027-28 plans get designed from January to March 2027. That is when the shared layer is easiest to set.
Start with a count. List every division plan and every file it lives in. Mark the rules that appear in all of them. Those rules become the shared layer. Each division then keeps only what its market needs. Leave room for a mid-year target revision. 2026 showed how far a forecast can move.
Yes, for the parts that reflect its market: focus brands, weights, targets and gate levels. Rules about fairness and control should stay common across divisions. That includes proration, data cut-off, exception approvals and the query path.
Split the month at the move date. Read sales before the move against the old plan, and after it against the new one. Prorate targets by days. Write that split into the shared rules before the period opens.
Run every division on the same data, cut-off and engine. Then compare payout against achievement on one view. Add incentive cost as a share of sales. What-if modeling lets finance compare a plan's cost before launch.
A shared rule lives in many copies, so one change needs many identical edits. A missed edit makes one division pay differently for the same event. Keeping shared rules in one place removes that risk.
Before division plans are drafted for the new year. For FY 2027-28, that means January to March 2027. Setting the shared layer first lets each division plan start from a common template.