FMCG incentives paid on revenue alone fund the discount.
November 10, 2025
Puneet Gupta
Puneet Gupta
Key Insights
McKinsey puts consumer goods trade promotion at about 20% of revenue.
In this blog:
How unintended incentive outcomes start in an FMCG plan
The arithmetic of a revenue-paid discount
Three signs the plan is funding the discount
Margin-linked incentive measures that fix it
In FMCG reviews, I often see two charts side by side. Volume is up. Price realization is down. The incentive payout has followed volume.
The plan is usually doing what it was built to do. It pays on revenue, so sellers trade price for volume. Distributor targets pay on primary sales. So stock is loaded before month end.
The fix sits inside the current plan. Add a price realization weight. Pay distributors on secondary sales. Read each scheme's return before it is renewed.
A question for the head of sales this week: which measure pays on margin?
McKinsey puts consumer goods trade promotion at about 20% of revenue.
In this blog:
How unintended incentive outcomes start in an FMCG plan
The arithmetic of a revenue-paid discount
Three signs the plan is funding the discount
Margin-linked incentive measures that fix it
In FMCG reviews, I often see two charts side by side. Volume is up. Price realization is down. The incentive payout has followed volume.
The plan is usually doing what it was built to do. It pays on revenue, so sellers trade price for volume. Distributor targets pay on primary sales. So stock is loaded before month end.
The fix sits inside the current plan. Add a price realization weight. Pay distributors on secondary sales. Read each scheme's return before it is renewed.
A question for the head of sales this week: which measure pays on margin?
Table Of Content
What trade spend and discounting cost a consumer goods company
Trade promotion is a large line in consumer goods. McKinsey puts it at about 20% of revenue each year. The same article cites Nielsen data on returns. Of the promotions studied, 59% lost money. In the United States, the figure was 72%.
Indian distributors are raising the same concern from their side. In June 2026, a distributor federation wrote to FMCG companies. It was the All India Consumer Products Distributors Federation. It asked for margin revision. It asked for an end to forced stock push. It asked for realistic inventory targets.
Sales incentives sit close to both problems. A seller paid on revenue gains from each discount that closes. A distributor target paid on primary volume gains from each case loaded.
Sources: McKinsey, How analytics can drive growth in consumer-packaged-goods trade promotions, 23 October 2019, global, citing Nielsen, 2016 · the 59% and 72% figures are Nielsen's, not India-specific · Business Today, 8 June 2026, reporting the AICPDF open letter to FMCG companies
A fifth of revenue goes to trade promotion, and 59% of promotions lost money.
How unintended incentive outcomes start in an FMCG plan
Unintended incentive outcomes start when the measure and the goal part ways. The company wants profitable growth. The plan pays on revenue or volume.
The research has described this tension for decades. Kissan Joseph reviewed it in the Journal of Marketing in 2001. Managers, he wrote, complain that price latitude leads sellers to discount. Discounting replaces the effort of selling. He also cited a 1979 study by Stephenson, Cron and Frazier. Firms giving the least pricing authority had the highest gross margins.
Discount authority is not the problem by itself. Frenzen and colleagues studied 181 German industrial firms in 2010. Delegating pricing helped performance where markets were uncertain. It helped where sellers knew customers better than managers did. What matters is what the seller is paid on.
In FMCG, the pattern shows up in four places.
Price. A seller with discount authority trades price for volume near month end.
Schemes. A trade scheme closes the gap to target, whatever its return.
Loading. Primary sales are pushed into distributors before the period closes.
Mix. Lower-margin packs are pushed because they move faster.
Sources: Joseph, On the Optimality of Delegating Pricing Authority to the Sales Force, Journal of Marketing, January 2001, vol. 65, a theory paper · Stephenson, Cron and Frazier, 1979, as reported by Joseph, hospital supplies industry · Frenzen, Hansen, Krafft, Mantrala and Schmidt, International Journal of Research in Marketing, 2010, 181 German industrial firms · none of these studies covers Indian FMCG
Revenue-alone pay rewards the discount that closes the sale.
The arithmetic of a revenue-paid discount
The rep and the company read the same discount differently. Take an illustrative pack at ₹100 with a 40% gross margin. The rep earns a share of revenue. The company earns the margin.
Illustrative. A 5% discount on a ₹100 pack with a 40% gross margin
Measure
Before
After 5% discount
Price per pack
₹100
₹95
Gross margin per pack
₹40
₹35
Volume rise for revenue to hold
None
About 5.3%
Volume rise for margin to hold
None
About 14.3%
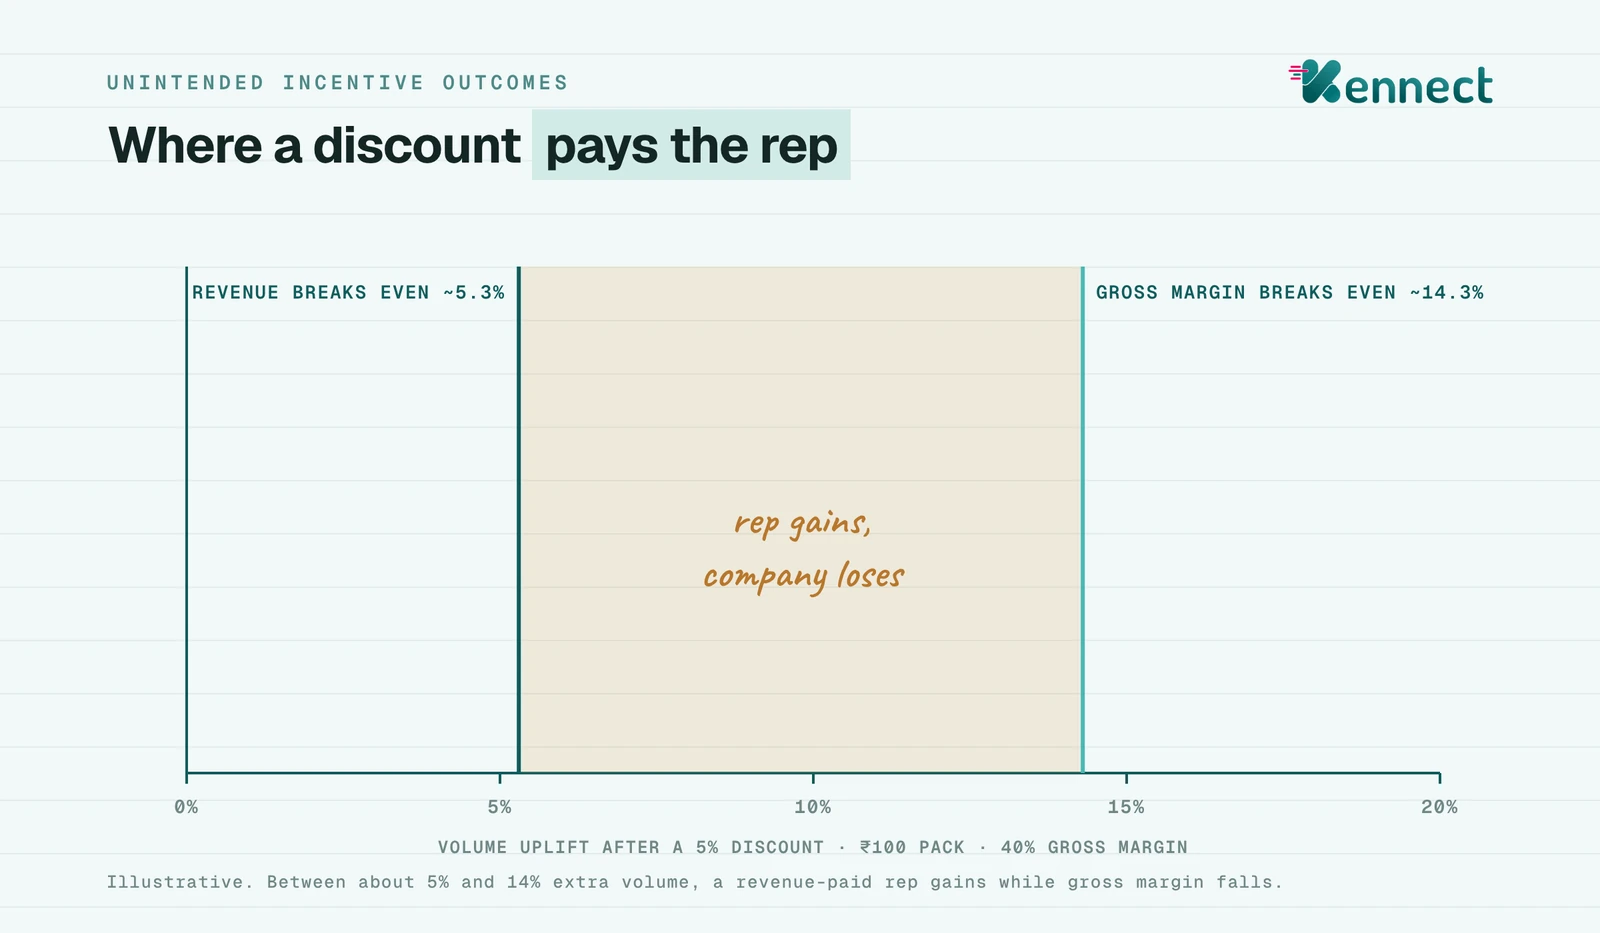
The two break-even points sit far apart. Revenue holds at about 5.3% extra volume. Gross margin holds at about 14.3%.
Between those two points, the rep gains and the company loses. Say the discount lifts volume by 10%. Revenue rises. The revenue-paid incentive rises with it. Gross margin falls.
Illustrative. Between about 5% and 14% extra volume, a revenue-paid rep gains while gross margin falls.
Between the two break-even points, the rep is paid for lost margin.
Three signs the plan is funding the discount
Each sign can have another cause. Read together, they point to the plan.
Price realization falls while volume rises
Track net price per case by territory each month. Compare it with volume growth. A territory where volume rises and realization falls is buying growth. Check whether its incentive rose too.
Primary sales spike at month end
Compare primary billing in the final week with the first three. Then compare primary with secondary sales. A gap that widens each quarter points to loading. Distributor inventory days will rise with it. The method is set out in stockist and secondary sales incentives.
Scheme spend grows faster than net revenue
Read trade scheme spend as a share of net revenue each quarter. Rising spend with flat net revenue means schemes buy volume at a loss.
Together, the three signs point to the plan.
Margin-linked incentive measures that fix it
A margin-linked incentive pays the seller on what the company keeps. It does not need a full redesign. Each fix below can sit inside the current plan.
Pay on price realization. Add a weight for net price per case against plan. Holding price then earns more than discounting to the same volume.
Pay on contribution, where data allows. Use gross margin or contribution per territory as one measure. Keep it simple enough for the rep to follow.
Pay distributors on secondary sales. Link distributor schemes to secondary sales and stock days. Primary loading then earns nothing extra.
Cap discount authority by role. Set a discount band for each level. Discounts above the band need approval. Record each approval.
Read scheme ROI before renewal. Measure the contribution margin on the incremental units. See return on incentives paid for the method.
The CSO's role is to explain the change to the field. Show each rep a worked example before the quarter opens. Show what holding price earns. Show what a discount costs them. Keep the volume measure in place, at a lower weight. Field teams accept a new measure faster when they can calculate it.
Dealer and distributor schemes need the same discipline. See dealer incentive management for how to run them.
When pay follows margin, a discount costs the seller too.
How Kennect helps align FMCG incentives with margin
In FMCG teams we work with, scheme spend is read after quarter close. We aim to show its return while the scheme is still running.
Scheme design and modeling. The scheme designer builds margin-linked and price realization measures. Scheme modeling costs a scheme before launch. It shows the payout at different volume and price outcomes. A festive scheme that pays on the wrong mix shows up early. The method is set out in incentive plan scenario modeling.
Secondary sales data.Secondary sales automation brings distributor sales into the plan. Connectors link the DMS, SFA and ERP, including SAP. Sales stays in the SFA. Finance stays in SAP. Fill the white spaces, do not disrupt the foundation.
One view of cost and return. The management cockpit shows payout, scheme spend and realization by territory. Plans and targets are held as dated versions, with an audit trail.
What the rep sees. The rep app shows the slab view and a what-if simulator. A rep sees what holding price earns against a discount.
Once inputs are clean, calculation runs 90x faster, by Kennect's measure.
Source: Kennect claim register · 90x faster calculation once inputs are clean · reference measure across deployments, inputs assumed clean
Kai, Kennect's AI: the AI KPI builder is live today. An admin describes a margin-linked KPI in a prompt. Kai builds it. Generative scenario modeling is expected January to March 2027. A plan designer will describe a scheme change in words. Kai will show its effect on payouts and cost.
A scheme read while it runs can be corrected in time.
What this means for the January to March quarter
The fourth quarter of the financial year starts on 1 January 2027. Year-end targets drive the heaviest push of the year. That push is where revenue pay funds discounts and loading.
The CFO and the CSO can agree on one shared view first. Put volume, realization, scheme spend and payout on one page. Read it by territory, every month.
Two changes can be made before then. Add a price realization weight to the quarter's plan. Link distributor schemes to secondary sales. Then read scheme ROI each month of the quarter.
Pay on what the company keeps, and the year-end push builds margin.
An FMCG plan paid on revenue alone pays for the discount that closes the sale.
Consumer goods firms invest about 20% of revenue in trade promotion. Margin-linked measures, secondary sales schemes and scheme ROI reads keep that spend working.
See how Kennect designs and costs margin-linked incentives.