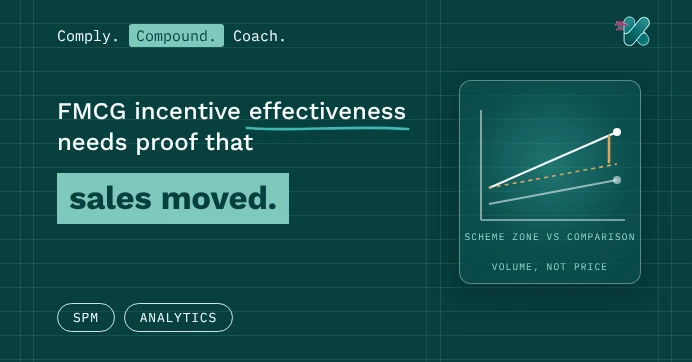
Incentive effectiveness in FMCG needs proof that sales moved
November 18, 2026
Puneet Gupta
Puneet Gupta
Key Insights
Only about 1 in 5 companies rated their 2025 sales comp plans very effective (Alexander Group, 2026).
In this blog:
Why FMCG incentive spend needs proof now
Four effectiveness pain points FMCG teams raise
Six checks for any scheme
What proof of effectiveness means for each FMCG leader
FMCG companies spend crores on incentives every year. Ask whether last quarter's scheme moved sales, and the room goes quiet. Sales went up, so the scheme worked? Or the market moved, and the scheme just paid for it? Without proof, every scheme gets renewed out of habit. With proof, budget moves to what works.
Ask your sales head this week: which scheme would you cut tomorrow, and why?
Only about 1 in 5 companies rated their 2025 sales comp plans very effective (Alexander Group, 2026).
In this blog:
Why FMCG incentive spend needs proof now
Four effectiveness pain points FMCG teams raise
Six checks for any scheme
What proof of effectiveness means for each FMCG leader
FMCG companies spend crores on incentives every year. Ask whether last quarter's scheme moved sales, and the room goes quiet. Sales went up, so the scheme worked? Or the market moved, and the scheme just paid for it? Without proof, every scheme gets renewed out of habit. With proof, budget moves to what works.
Ask your sales head this week: which scheme would you cut tomorrow, and why?
Table Of Content
Why FMCG incentive spend needs proof now
Few companies are confident their plans work. Alexander Group found only about 1 in 5 rated their 2025 plans very effective.
Fix: model cost before launch, and measure uplift after.
Each pain point is answered with data the scheme already produced.
Six checks for any scheme
Run these after every scheme cycle.
Check
Question
Where to look
Earners
Did more people earn than last period?
Earner count, by region and role
Gates
Which condition blocked people?
Gate failures, by zone
Mix
Did focus brands grow faster than total?
KPI-wise achievement
Volume against a comparison group
Did the scheme group outgrow a similar group without it?
Volume, before and during, for both groups
Cost per incremental unit
What did each extra case cost?
Scheme cost divided by the extra volume
Retention
Did top earners stay?
Leavers compared with stayers
A framework for review, adapted to each scheme.
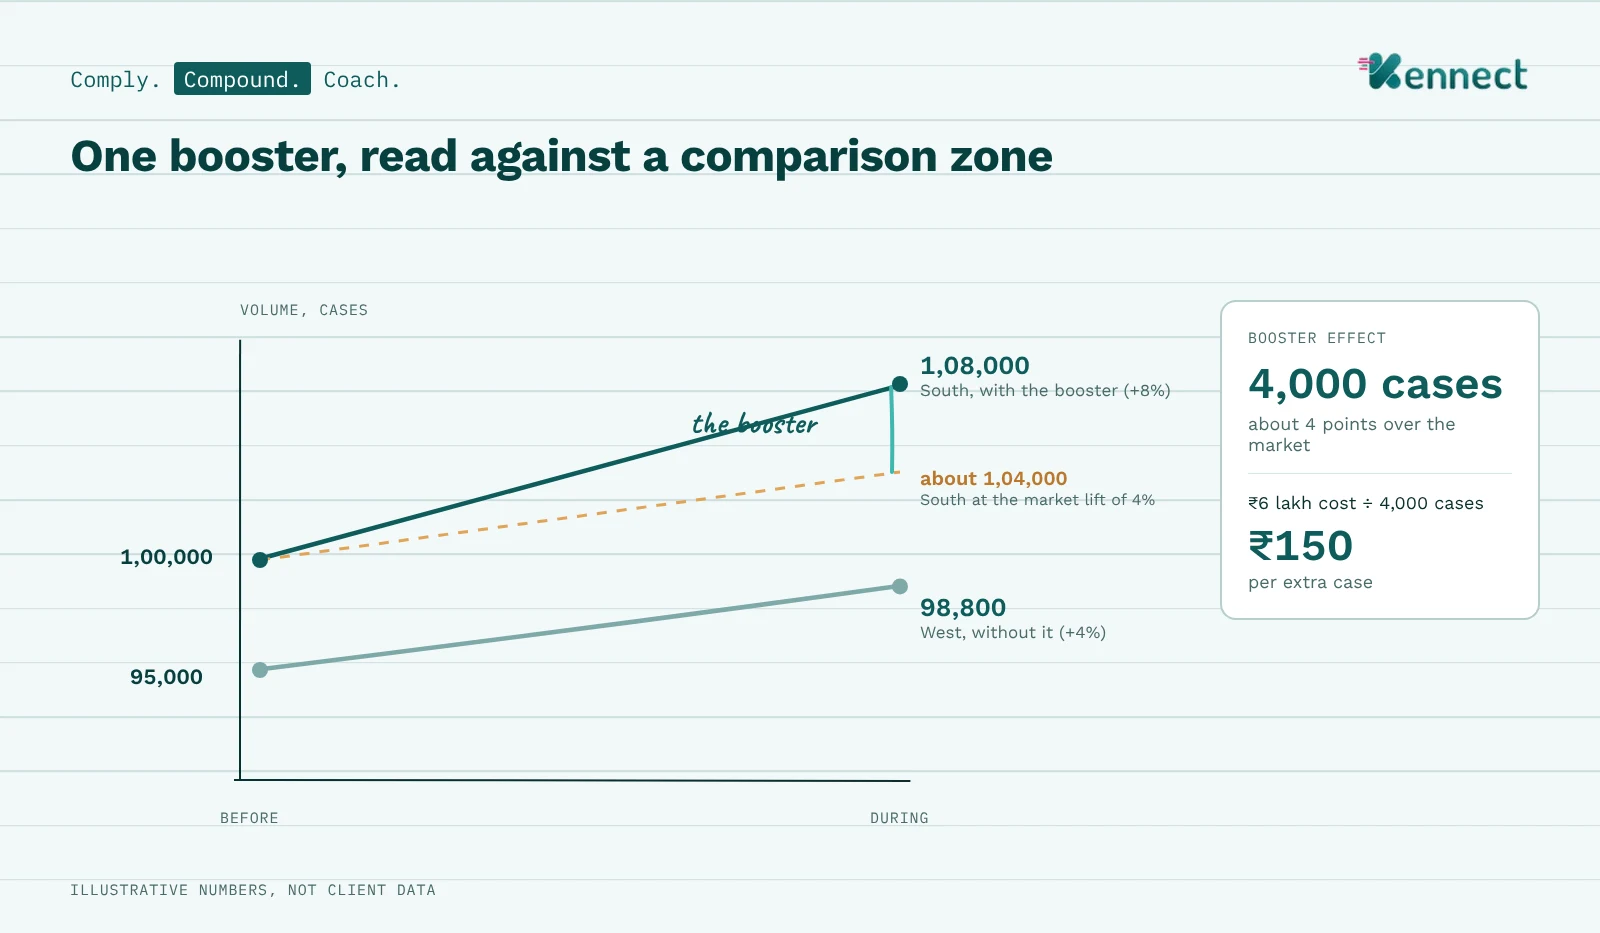
Start with the comparison group. A plain before-and-after view also catches price rises, season and market swings. Measure volume, so price growth doesn't flatter the scheme. Pick a comparison group with similar beats and history.
Here is how one booster reads:
Group
Volume before (cases)
Volume during (cases)
Change
South zone, with the booster
1,00,000
1,08,000
+8%
West zone, without it
95,000
98,800
+4%
Illustrative numbers, not client data.
The market lifted both zones by about 4%. The booster added about 4 more points in South, roughly 4,000 cases. It cost ₹6 lakh, so each extra case cost about ₹150. Compare that with the margin on a case, and the renewal decision makes itself. See how FMCG sales contests work on a steady plan.
Six checks turn "did it work?" into an answer.
What proof of effectiveness means for each FMCG leader
Proof that a scheme worked matters well beyond the sales team. Each leader reads it differently.
Leader
Their question
What this approach gives them
CEO or MD
Is incentive spend growing the business?
Volume against a comparison group, by region and role
CFO
Where should next year's budget go?
Cost modeled before launch, and cost per incremental case after
Sales head (CSO or NSM)
Which scheme should I cut?
Gate failures and earners, by zone
Brand or marketing head
Did focus brands actually move?
KPI-wise achievement, brand by brand
CHRO
Are we losing top earners?
Leavers compared with stayers
CIO or IT head
Do we need a separate BI project?
Analytics built into the incentive system
MIS or sales ops
Can we stop building reports by hand?
Period-on-period views, ready each cycle
Evidence on schemes helps every leader make the next call.
How Kennect and KAI show what worked
Kennect is an AI-led sales performance and incentive compensation management platform. One rule engine runs salesman incentives, distributor claims and dealer schemes.
Compound: scheme analysis. Analytics show earners, average payout and total payout. Each splits by region, area and role, period on period. Before-and-after views compare performance around a scheme. See scheme analysis.
Compound: gates and breakdowns. For each plan, Kennect counts gate failures by zone. Each payout has a KPI-wise breakdown.
Compound: retention. Leaver analytics compare people who resigned with those who stayed.
Comply: cost before launch. KAI Simulations and scenario modeling estimate a scheme's cost and earners. Sales uplift is measured after launch. More on incentives and revenue.
KAI in practice. A sales head asks who missed the growth gate, by zone. KAI Insights answers from the latest data load. He fixes that gate before renewing the scheme.
Kennect shows which schemes moved sales, and which only paid out.
Renewing schemes out of habit?
Run the six checks on your last scheme, with your own data.
It also picks up price rises, season and market swings. Compare the scheme group with a similar group that didn't run it. Use volume, so price growth doesn't flatter the result.