
Unlock 2024 Sales Comp Secrets: Our "Ultimate Guide to Sales Compensation" is here!Unlock 2026 Sales Comp Secrets: Our "Ultimate Guide to Sales Compensation" is here!Download Guide

Blog
Sales Performance Reporting: Everything You Need to Know!
April 14, 2023

Key Insights


Preface:
Modern markets demand sales managers who are bold with their strategies. In an article written for the Harvard Business Review, author Steve W. Martin points out that 69% of salespeople who exceeded their annual quota rated their sales manager as being excellent or above average.
The conclusion that should be drawn from this study is simple- an excellent sales manager armed with valuable insights can lead the sales team toward higher turnovers.
As a sales leader, you are undoubtedly familiar with the go-to mantras of sales coaching tips. These mantras emphasize the importance of experimenting with new ideas and discarding ineffective ones, as well as the significance of hiring the right people and establishing improved communication channels. Despite their apparent simplicity, there is a crucial aspect to consider when implementing these principles.
There is no denying that the role of a sales leader is becoming increasingly challenging day by day. Growth leaders are faced with the daunting task of achieving aggressive goals in a remarkably short period of time to combat cut-throat competition.
The truth is that most leaders struggle to keep up with this changing demand of the role resulting in an exhausted sales team with a significantly low output. It's time to reevaluate and refresh your sales playbook to meet these evolving challenges.
So what can you do to deliver the perfect platter of valuable insights, accurate forecasts, and a strategy that works in real time?
The answer is simple: a data-driven approach backed by frequent and efficient reports!
- Data-driven decision making: When evaluating the performance of your sales rep vs associates, a data-driven approach provides the clarity needed to identify strengths and areas for improvement.
- Forecast vs projection: Understanding the difference between forecasts and projections is crucial for accurate planning. Forecasts predict what is most likely to happen based on historical data and trends, while projections estimate outcomes under various hypothetical scenarios.
- Frequent and efficient reports: Timely reports keep you informed and allow you to course correct as needed.

What is a Sales Performance Report?
To put it simply, a sales performance report is a document that provides an overview of a company's sales activities, metrics, and results within a specific period.
It is used by sales managers and executives to evaluate the performance of their sales team, identify areas for improvement, and make data-driven decisions. It typically includes information such as the number of sales, revenue generated, average sale price, customer acquisition cost, conversion rate, and other relevant sales data.
The report can be generated on a daily, weekly, monthly, or quarterly basis, depending on the needs of the organization.
Key Elements of a Sales Performance Report
The specific elements of a sales report may vary depending on the purpose of the report and the target audience, but some common key elements may include:
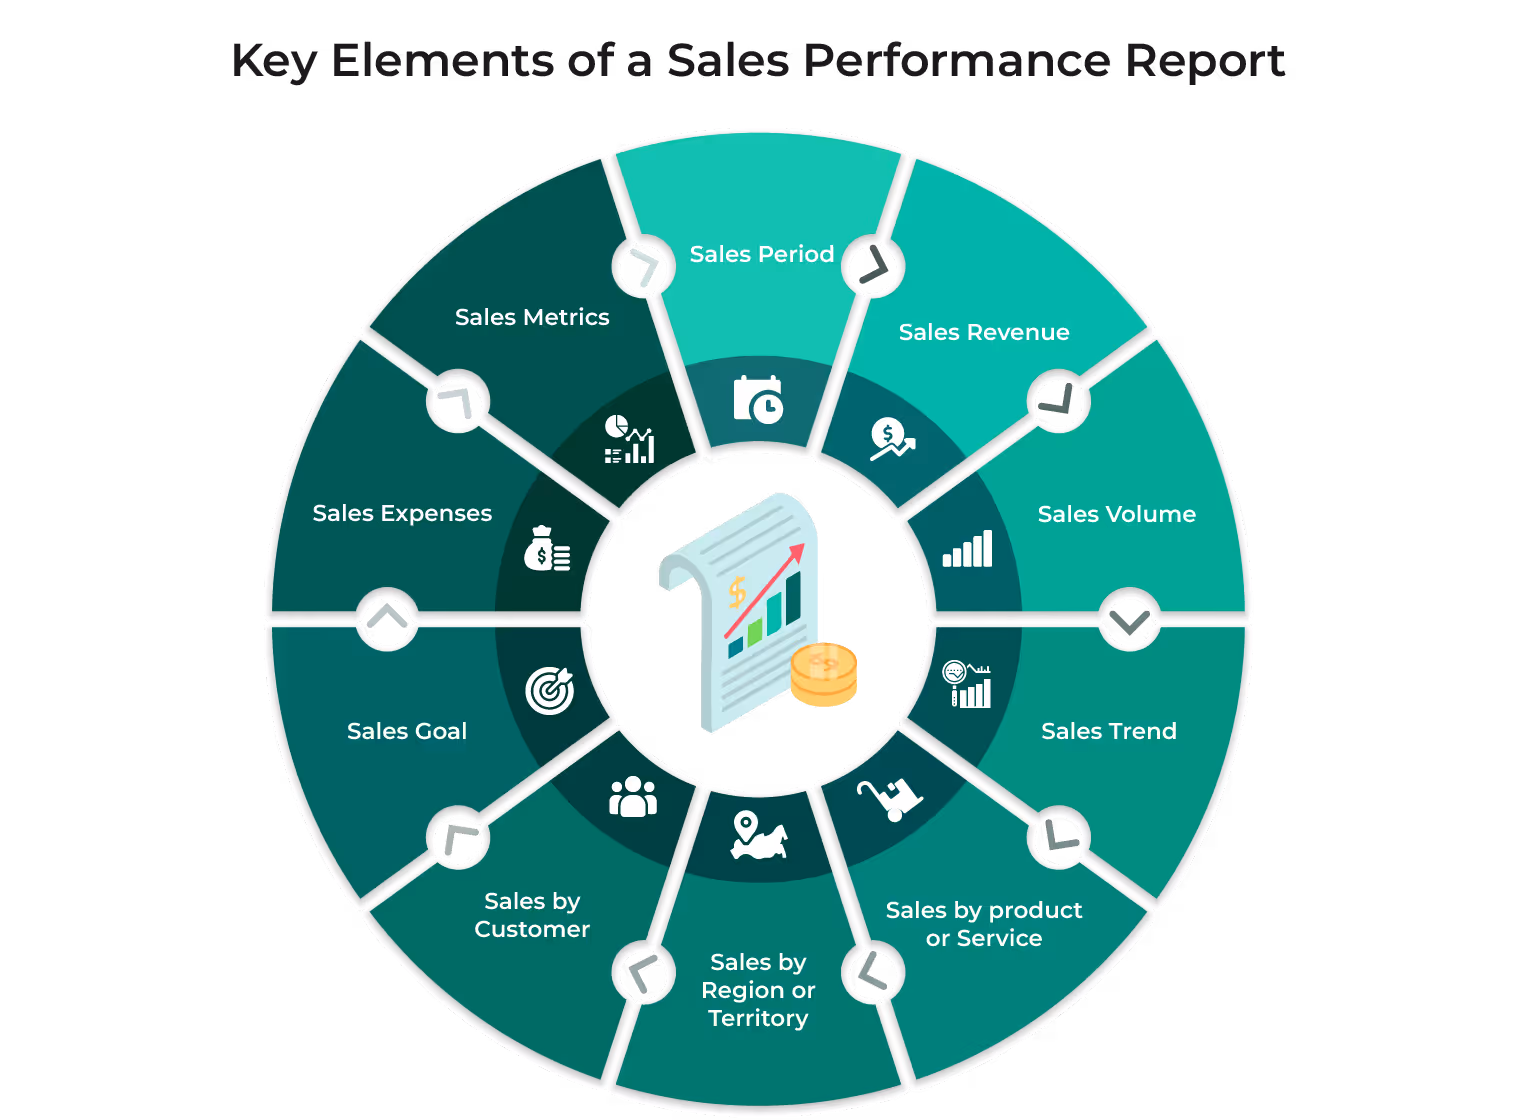
Sales Period
The specific time frame for which the report is being generated, such as a week, month, quarter, or year.
Sales Revenue
The total revenue generated from sales during the period, including both product sales and service sales.
Sales Volume
The total number of units sold during the period, including individual product or service sales, and the total volume of sales.
Sales Trends
Analysis of sales performance over time, including trends in revenue and volume, as well as changes in customer behavior or market conditions.
Sales by Product or Service
A breakdown of sales by individual product or service, including sales volume, revenue, and average price per unit.
Sales by Region or Territory
A breakdown of sales by geographic region or sales territory, including sales volume, revenue, and average price per unit.
Sales Goals
A comparison of actual sales performance to predetermined sales goals or targets, including any variance analysis and explanations for any discrepancies.
Sales Expenses
A breakdown of the expenses associated with sales efforts, including costs for marketing, advertising, commissions, and other related expenses.
While some of the essential components that could be incorporated in a sales report may vary depending on the specific needs and goals, additional or subtracted elements may also be determined based on the sales funnel and pipeline.
Types of Sales Performance Reports
Sales performance reports can vary based on the needs and goals of a business. However, here are some common types of sales performance reports:
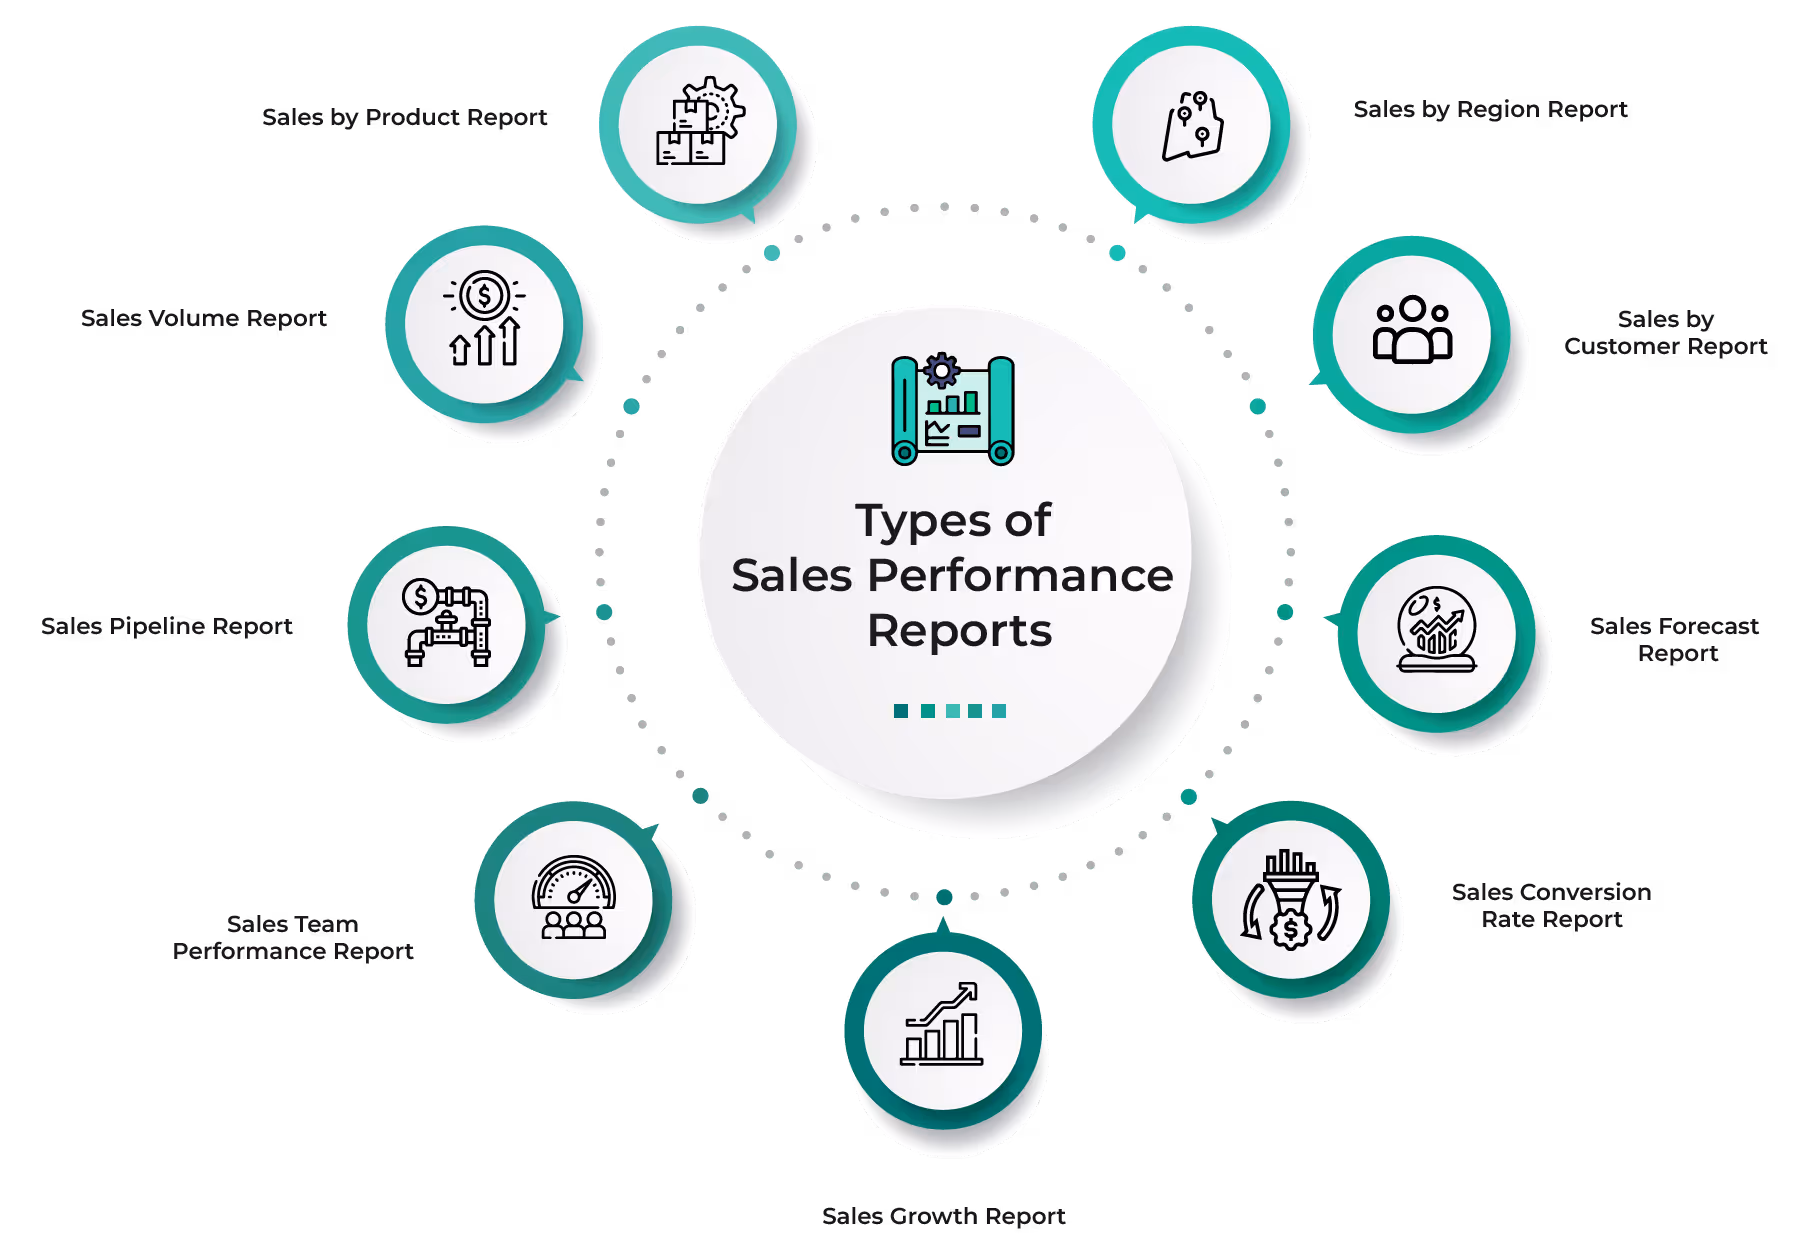
- Sales Volume Report: This report provides an overview of the total sales volume generated over a period of time.
- Sales by Product Report: This report shows the sales performance of each product or service sold by the company.
- Sales by Region Report: This report shows the sales performance of the company broken down by geographical region.
- Sales by Customer Report: This report provides insight into the sales performance of individual customers or groups of customers.
- Sales Pipeline Report: This report tracks the progress of leads through the sales funnel and helps to identify potential issues in the sales process.
- Sales Forecast Report: This report predicts future sales based on historical data and current trends.
- Sales Team Performance Report: This report evaluates the performance of individual sales team members and the team as a whole.
- Sales Conversion Rate Report: This report shows the percentage of leads that are converted into sales, which can help identify areas for improvement in the sales process.
- Sales Growth Report: This report shows the percentage increase or decrease in sales over a period of time, which can help identify trends and opportunities for growth.
These reports can be generated regularly or on an ad-hoc basis to provide a snapshot of the company's sales performance.
Tips for Efficient Sales Performance Reporting
Needless to say, sales performance reporting is essential for any business to track its sales progress and make data-driven decisions. Here are some tips and techniques for effective sales performance reporting:
- Set clear objectives: Start by defining the objectives of your sales performance report. Identify the key metrics that you want to track and report on, such as revenue, customer acquisition, or lead generation. This will help you create a more focused and meaningful report.
- Use data visualization: Data visualization can make your sales performance report more engaging and easier to understand. Use charts, graphs, and tables to present your data in a clear and concise manner.
- Track leading and lagging indicators: Leading indicators are predictive of future sales, while lagging indicators reflect past performance. It's important to track both to get a comprehensive view of your sales performance. For example, a leading indicator might be the number of leads generated, while a lagging indicator might be revenue generated.
- Segment your data: Segment your sales data by product, sales team, or region using advanced sales data analysis techniques to identify areas of strength and weakness, enabling you to pinpoint opportunities for improvement and make more informed decisions.
- Compare against benchmarks: Comparing your sales performance against industry benchmarks or historical data can provide valuable insights into how your business is performing. This can help you identify areas where you need to improve or where you're outperforming your competitors.
- Make it actionable: Your sales performance report should not just be a collection of data. It should provide actionable insights that can help your sales team improve their performance. Make sure your report includes recommendations for improvement based on the data you've collected.
- Use automation: Automating your sales performance reporting can save time and ensure accuracy, especially when leveraging tools like CRM software, data collection tools or business intelligence dashboards to automate data collection and reporting, and setting up a pipeline dashboard for comprehensive visualization of your sales funnel.
Swear by this checklist to create efficient reports!
Leveraging Big Data
The difference between a sales plan that works and a sales plan that does not work is data! Data can help you:
- Find new leads
- Retain your existing clients
- Ramp up your marketing efforts
- Make better predictions
- & many more.
Let’s be clear though - not all data is good data. Ask yourself these three simple questions to make sure that the data you are collecting is the perfect raw material for a successful plan-
- Do you have enough data?
There’s a reason why it’s called Big Data. The aim is to be comprehensive. To collect as much data as is needed for creating a plan that works. The data that you are feeding your CRM needs to be gap-free and have all the relevant information. Remember, the end goal is to have a data set large enough to be turned into actionable insights.
- Is your data accurate and trustworthy?
It’s one step forward and two steps backward if you have enough data but do not trust it. In fact, 84 % of CEOs don’t trust the data that they are basing their decisions on according to Forbes. All it takes is one wrong keystroke! Try to minimize errors by reducing manual input and automating your data-capturing process.
- Is your data uniform?
Think of it this way. Two sales reps may use their own phrases for a similar scenario. One rep may say that your product was ‘too expensive’ while another rep may choose to say a ‘competitor was cheaper’. Simple issues like these may lead to a heterogenous set of data that is hard to work around.
The Ultimate Red Flag- Annual Reports!
You have the Big Data. But the big question is- what to do with it? A drill-down approach to devise a data-driven strategy is necessary. Questions like these can be addressed-
- Do you have enough reps?
- Are your reps able to meet their quotas?
- Are your incentives motivating your reps?
- Do you have the right software to predict payouts and future ‘what if’ situations?
- What are the visible trends and patterns?
The elephant in the room is that for most companies, sales planning and reporting is still an annual process! There are reasons for that- it is a time-consuming task and most companies still rely heavily on manual processes to make these reports.
Often, reports are made months after a financial year ends. And even when they are available, they are not audit-ready, making it hard for finance teams to work on them.
It is therefore impossible for sales leaders to take bold decisions like changing their incentive compensation plans. This static approach can stifle business growth significantly. Sales leaders need to look at the macroscopic impact of inadequate reports and then make microscopic changes in the way data is collected and analyzed.
Final Thoughts
It goes without saying that sales performance reporting is essential for any organization that wants to optimize its sales operations, drive revenue growth, and align with a modern sales process.
Don’t break a sweat to get the reports you need with Kennect’s Sales Performance Management Software
- Kennect integrates with your existing tools and generates efficient reports
- Why spend another day sharing data with Audit when Kennect can provide you with audit-ready reports
- Get readily available payout reports that comply with your accounting system standards such as ASC606
Book a demo today!

ReKennect : Stay ahead of the curve!
Subscribe to our bi-weekly newsletter packed with latest trends and insights on incentives.
Thank you! Your submission has been received!
Oops! Something went wrong while submitting the form.
Your data is in safe hands. Check out our Privacy policy for more info
Related Articles


.avif)


Address
Kennect
224 W 35th St 500 820
New York , NY 10001
(415) 799-4494
224 W 35th St 500 820
New York , NY 10001
(415) 799-4494
Contact
Phone : (415) 799-4494
Email : info@kennect.io
Social


Achivement

© 2024 Kennect - All Rights Reserved.
Privacy Policy