Unlock 2024 Sales Comp Secrets: Our "Ultimate Guide to Sales Compensation" is here!Unlock 2026 Sales Comp Secrets: Our "Ultimate Guide to Sales Compensation" is here!Download Guide

Blog
How to Run Sales Performance Management
June 4, 2022


Key Insights


How to Run Sales Performance Management: The Operating Rhythm
What this covers.
Writing on sales performance management usually describes what a system does. This describes what you do: the four things worth measuring, the order to fix them in, and a single diagnostic that tells you whether your gap is a plan problem, a coverage problem or a capability problem. For CROs, sales leadership and the ops teams who carry the reporting.
What sales performance management is, operationally
Sales performance management is the practice of setting the number, distributing it fairly, measuring against it honestly, and paying for it provably. Four jobs. Many organisations do the first and the fourth, and improvise the two in between.
That improvisation is where the arguments come from. A quota nobody believes produces a forecast nobody trusts, and a forecast nobody trusts produces a compensation conversation that is really a negotiation. The system is not the point. The rhythm is. All four jobs run on the same data, which is the case for treating them as the unified compensation platform rather than four disconnected reports.
It is worth stating the stakes plainly, because performance management is often treated as reporting overhead rather than a growth lever. McKinsey research found that smart revisions of compensation models have a 50 percent higher impact on sales than changes in advertising investment (October 2018). The mechanism that connects performance to pay is not admin. In a lot of companies it is the largest uninstrumented lever on the P&L.
Read the shape, not the average
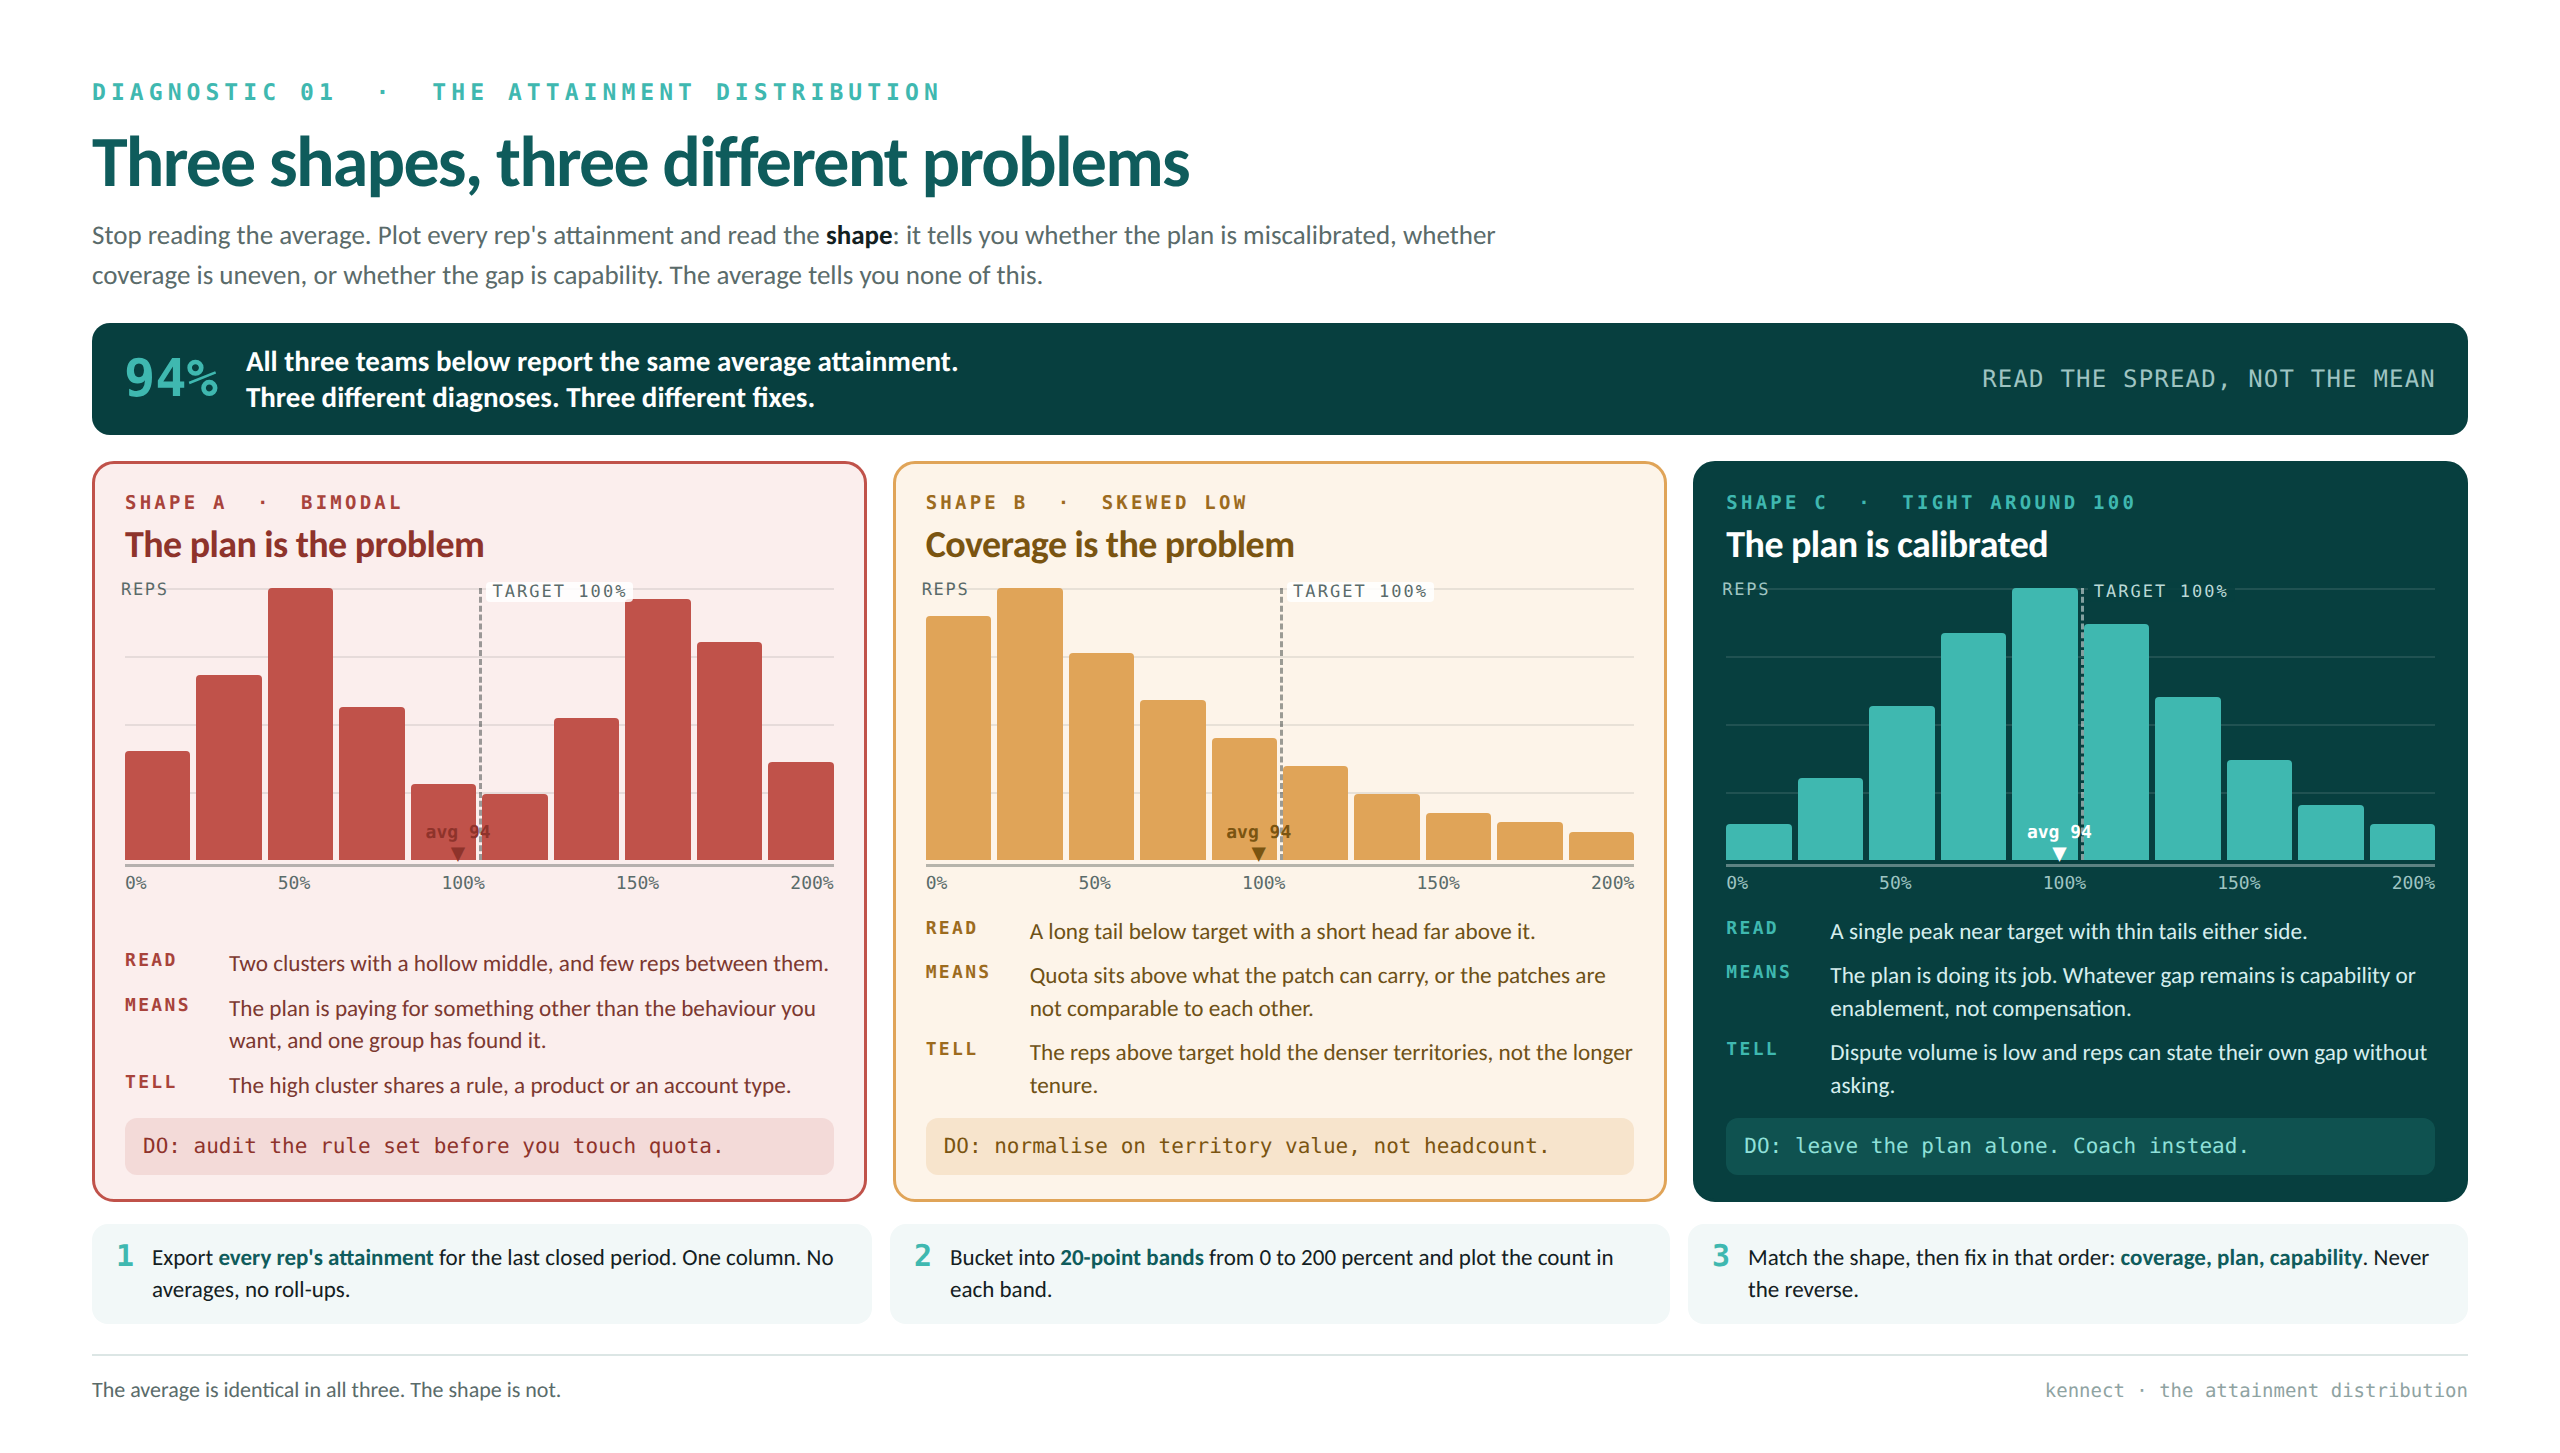
Average attainment is the least informative number in sales reporting. Three organisations can report 94 percent and be in completely different trouble. Plot every rep's attainment as a distribution and the shape answers the question the average hides.
- Bimodal, hollow in the middle. Two clusters, one well above target and one well below, with few reps between. The plan is paying for something other than the behaviour you want, and one group has found it. Audit the rule set before you touch quota.
- Skewed low with a long tail. Many reps under target, a few far above. Quota is set above what the territory can carry, or the patches are unequal. Normalise on territory value rather than headcount before you conclude anything about the people.
- A single peak near 100. The plan is calibrated. Whatever gap remains is capability or enablement, and no compensation change will close it. Leave the plan alone and coach.
This is the cheapest diagnostic in the discipline and it is rarely run, because the reporting pack is built to show trend, not spread. That is usually where sales performance analytics stops.
The four measures that matter, in order
Order matters because each one makes the next readable. A longer list of the KPIs worth tracking becomes useful once these four are stable.
- Quota coverage. Total quota against total addressable opportunity. If coverage is above 1.0 you are asking the market for more than it contains, and every downstream metric will look like a people problem. Coverage is a territory planning question before it is a quota question.
- Attainment distribution. The shape, as above. Only meaningful once coverage is sane.
- Cost per unit of incremental revenue. Not total payout, which rises with revenue whether or not the plan caused it. Incentive cost against incremental revenue is the version of this number that answers "is the spend working".
- Dispute rate and time to resolution. The trust metric. A rising dispute rate is an early warning that reps have stopped believing the calculation, and it precedes a drop in the other three. Read it beside your sales productivity metrics rather than on its own.
The 3C Ladder applied to measurement
The same three stages that govern compensation govern its measurement, and you cannot skip.
Comply: the measure is provable
Every number in the pack can be traced to source and reproduced. The test: can two people independently produce the same attainment figure for the same rep for the same period? If not, you are managing a report rather than a business.
Compound: the measure is predictive
You can model the effect of a change before making it. The test: can you say what moving quota up five percent will do to attainment distribution and to payout, before the quarter opens?
Coach: the measure changes behaviour
The metric reaches the person who can act on it, while they can still act. The test: does a rep see their own gap without asking anyone, and does their manager see the same number?
The monthly rhythm
What good looks like as a calendar, not a capability list.
- Week 1. Close the prior period. Reproduce the payout run from source. Publish attainment before anyone asks.
- Week 2. Review the distribution, not the average. Flag any territory that moved quadrant on the balance test.
- Week 3. Exceptions and disputes cleared to zero. Anything unresolved after 15 days gets escalated with a named owner, not carried.
- Week 4. Forward look. Model any rule change proposed for next period and price it before it is agreed.
Cadence is not a neutral choice. A Harvard Business School study of quota frequency found that shortening the cycle raised sales 11.7 percent in the lowest-performing segment and reduced them 8.1 percent in the highest (Chung, Narayandas and Chang, HBS working paper 17-059, 2019). Changing the rhythm changes who wins under it, so change it deliberately. Skipping week 4 is how teams walk into the five common sales planning challenges year after year.
Nothing here requires software. All of it is easier with it, which is a different claim and the honest one.
The 10-point audit
- Can two people independently reproduce the same attainment figure?
- Is total quota above or below total addressable opportunity?
- Do you look at the distribution, or only the average?
- Is incentive cost measured against incremental revenue, not total payout?
- Do you know your dispute rate, and is it trending?
- Is there a named owner and a clock on every open dispute?
- Can a rep see their gap to next threshold without asking?
- Does the manager see the same number the rep sees?
- Can you cost a rule change before agreeing it?
- If the person who builds the pack left tomorrow, does the rhythm survive the month?
Points 1 to 4 are Comply. Points 5 to 8 are Compound. Points 9 and 10 are Coach.
Where to start
Plot the distribution for the last completed quarter. It takes an afternoon and it will tell you, before any project starts, whether you are about to fix the right thing. Teams regularly discover they have been running a coaching programme against a plan problem. If it helps to see how customers measure it before you begin, start there instead.
Frequently asked questions
How do I know if our sales performance problem is a plan problem or a people problem?
Look at the distribution rather than the average: if attainment clusters tightly around 100 percent the plan is calibrated and the issue is coverage or capability, while a wide bimodal spread usually means the plan is paying for something other than the behaviour you want.
What should a sales performance management system give me that a CRM does not?
A CRM records what happened; performance management decides what it was worth, which is why quota coverage, attainment distribution and incentive cost all sit outside CRM by design.
What metrics actually matter for measuring a sales team?
Four, in this order: quota coverage against addressable opportunity, attainment distribution, incentive cost per unit of incremental revenue, and dispute rate with time to resolution. Anything else is a subdivision of one of these.
How often should we review sales performance?
Monthly for the rhythm and never mid-period for the rules. A metric reviewed quarterly arrives too late to change the quarter it describes.
Who should own sales performance management, sales or finance?
Sales owns the number and the distribution; finance owns the cost and the audit. The arrangements that fail are the ones where one function holds both.
Is average attainment a useful metric?
On its own, no. Three organisations can report the same average while being in completely different trouble, because the average erases the spread that tells you what is wrong.
How do I reduce commission disputes?
Give reps visibility of the derivation, not just the total. People query a number they cannot see the working for regardless of whether it is correct, which is why 80% fewer queries is an outcome of transparency rather than accuracy.
Related reading
- How to measure sales performance: the KPIs worth tracking
- What is sales performance analytics
- Overcoming the five common sales planning challenges
- Ten essential sales productivity metrics

ReKennect : Stay ahead of the curve!
Subscribe to our bi-weekly newsletter packed with latest trends and insights on incentives.
Thank you! Your submission has been received!
Oops! Something went wrong while submitting the form.
Your data is in safe hands. Check out our Privacy policy for more info
Related Articles





Contact
Phone : (415) 799-4494
Email : info@kennect.io
Social


Achivement

Address
P3, Officebing, Kailash Business Park, Hiranandani Link Rd, Vikhroli (W), Mumbai, Maharashtra 400079 India
224 W 35th St, Ste 500-820New York, NY 10001USA
3rd Floor, Orchid Centre, Sector 53, Gurugram, Haryana 122002 India
© 2024 Kennect - All Rights Reserved.
Privacy Policy